
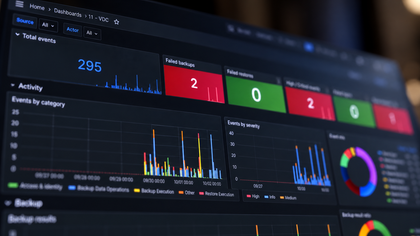
Monitoring VDC using Grafana
Discover how to monitor Veeam Data Cloud events in Grafana using VDC SIEM integration and Generic Webhooks. This guide shows how to collect events with Telegraf HTTP Listener, store them in InfluxDB, and build custom Grafana dashboards with InfluxQL for clear, flexible monitoring.


How I build a fully tailored VDC reports & interactive dashboard using MCP
Build a fully tailored Veeam Data Cloud (VDC) dashboard with Claude Cowork / Desktop and MCP. Learn how to collect VDC metrics, create interactive reports, automate daily refreshes, and get live data on demand.

M365 - Rapid SharePoint recovery strategies : minimal downtime
When it comes to M365, downtime means lost productivity, and it’s even more critical for SharePoint corporate sites. To manage this risk, a solid disaster recovery plan needs to be in place, with one key question in mind: what’s my targeted RTO for this data?